Reports – Overview
Understanding your reports is key to improving performance and tracking metrics. Here’s a simple guide to access and interpret your reports in lemlist.
Accessing Reports
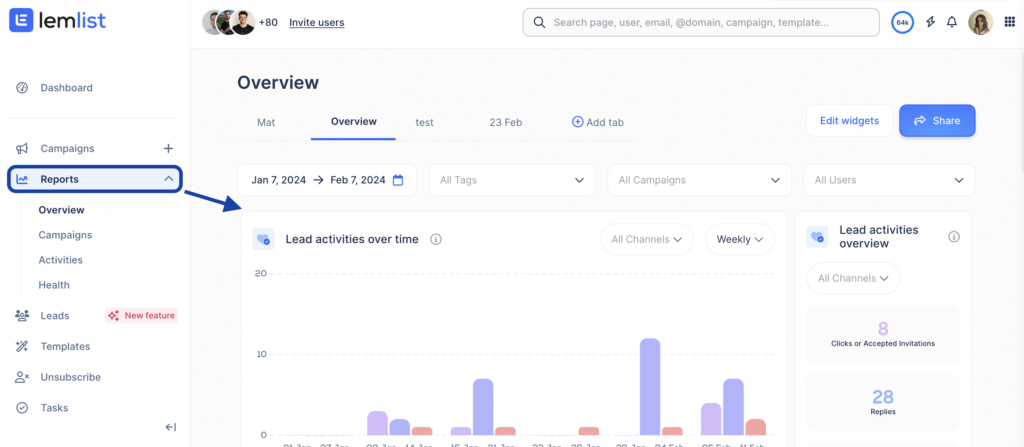
At the top of the page, you’ll see options to organize your reports:

- Tabs: Create and save tabs for easy access in the future.
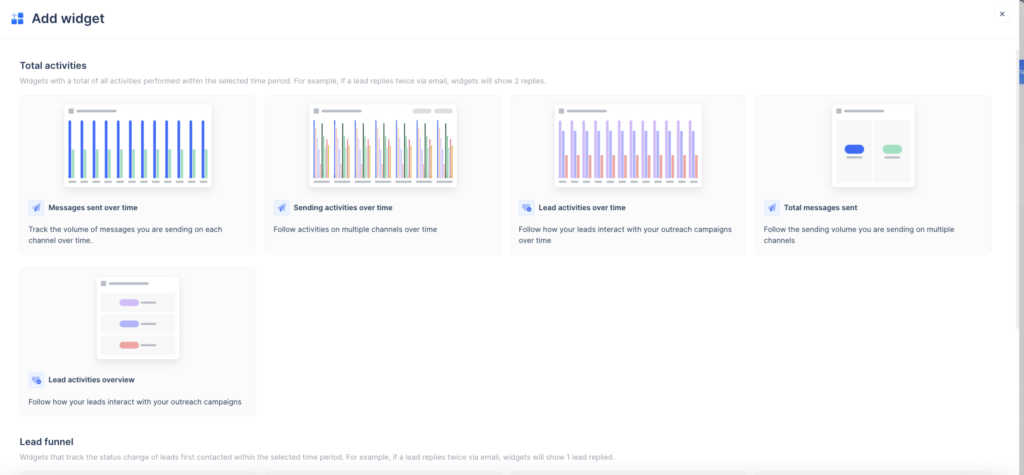
- Add/Edit Widgets: Customize your report by adding components. You can always edit later.
- Share button: Share your reports via a restricted link (for teammates) or a public link (for others).
Using Filters
Filters help you view reports for a specific period or campaign.

You can filter by:
Lead Interaction Overview
We track leads that were contacted during the selected time period.
You’ll see two types of widgets:
Widget Examples
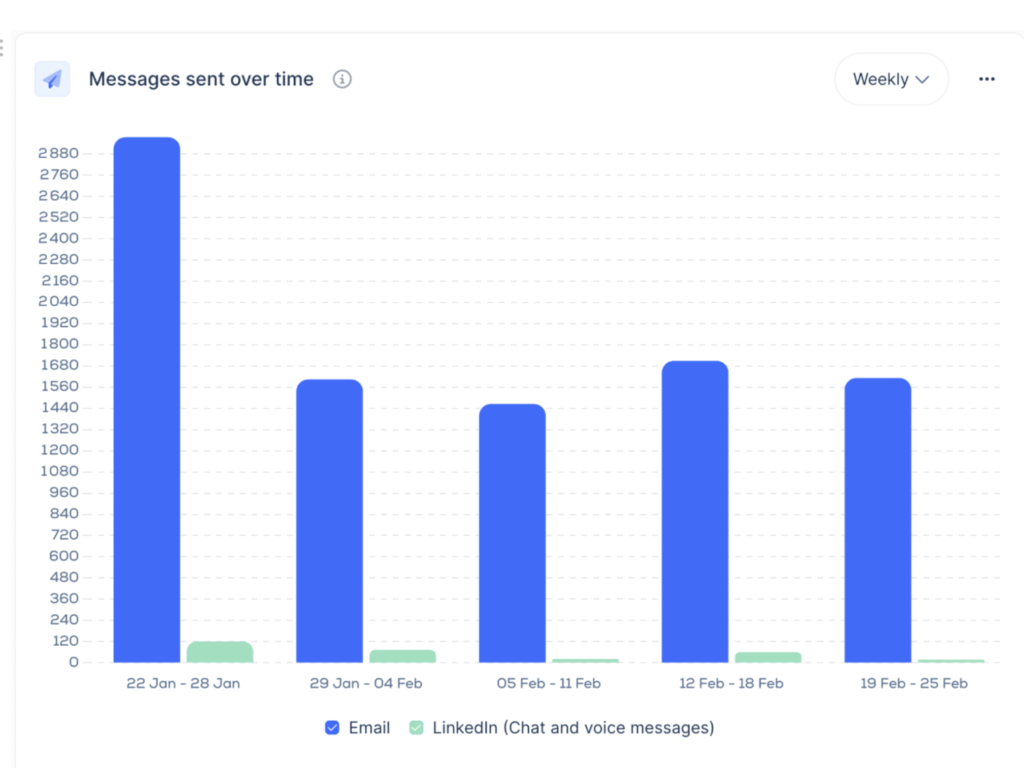
Widget #1: Messages sent over time
Shows the number of messages sent across different channels (email, LinkedIn, etc.) during the filtered time period.
Hover over the chart to see the exact number of emails or LinkedIn messages sent.
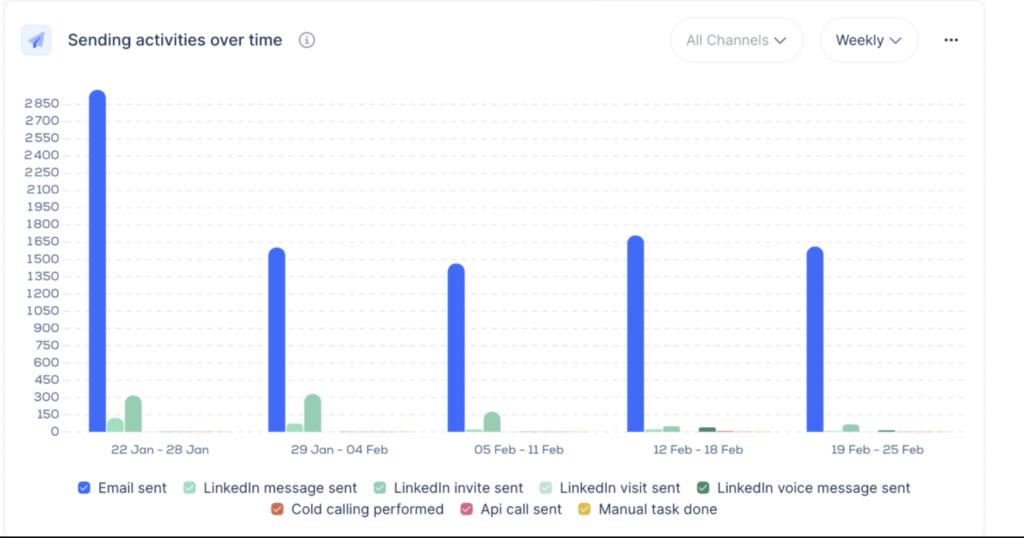
Widget #2: Sending activities over time
Tracks the number of activities (emails, LinkedIn messages, etc.) sent across different channels over time.
You can toggle between time intervals (daily, weekly, monthly) and channels (LinkedIn, email, phone, etc.).
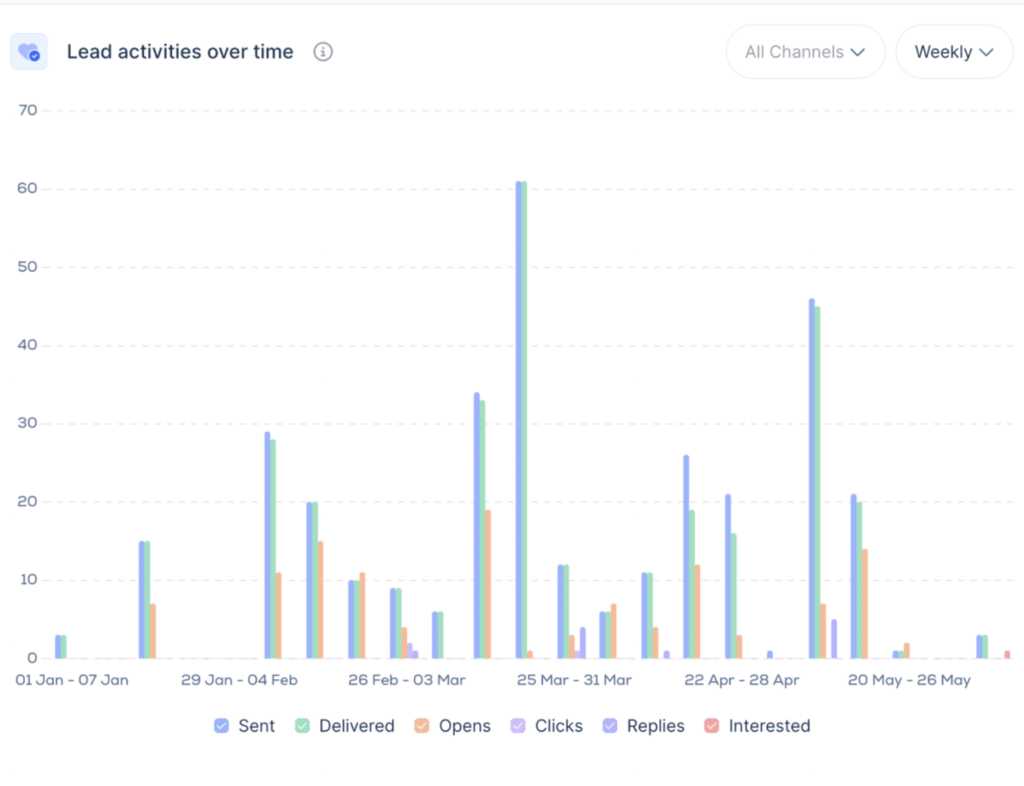
Widget #3: Lead activity over time
Tracks lead engagement over time, showing key interactions like sent, delivered, opened, clicked, replied, and interested.
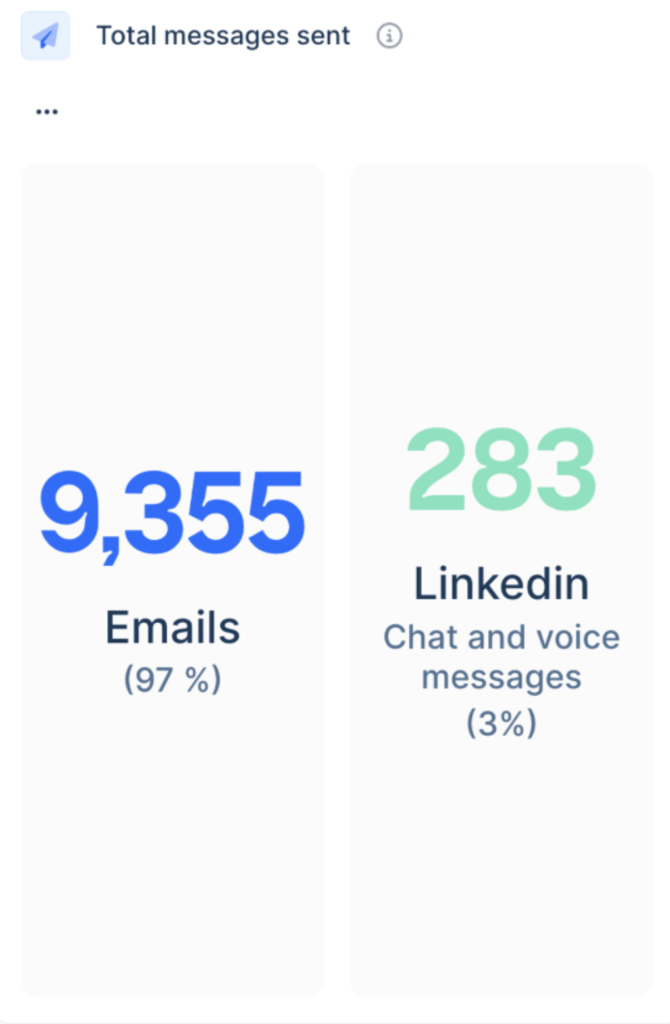
Widget #4: Total messages sent
Displays the total number of messages sent across all channels (email, LinkedIn, etc.) during the selected period.
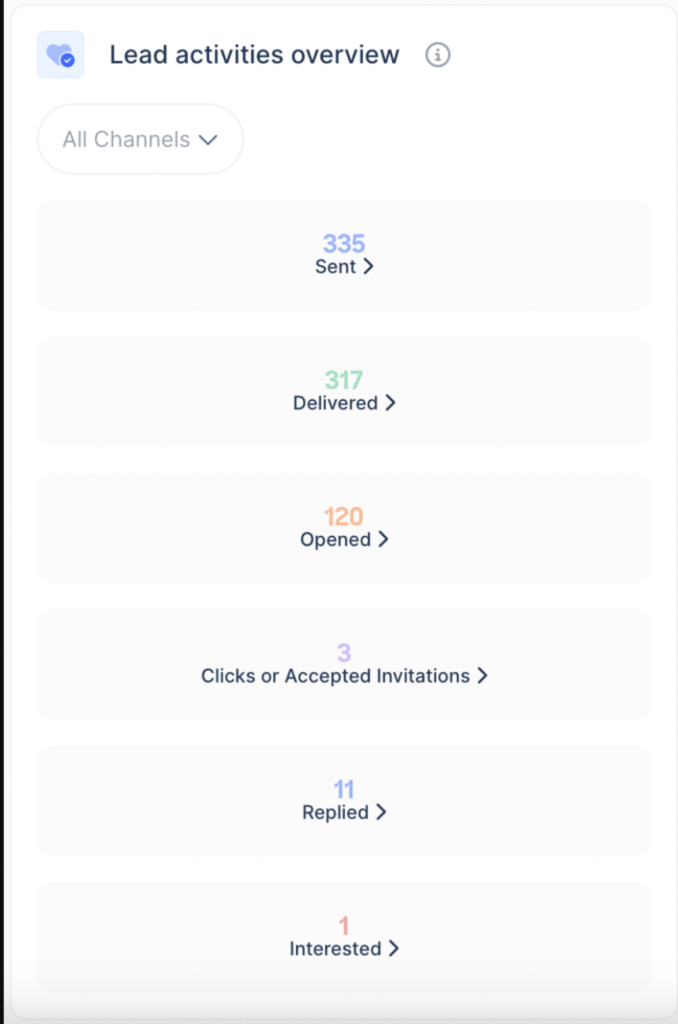
Widget #5: Lead activity overview
Shows the volume of leads sent, delivered, opened, clicked, replied, and marked as interested.
You can analyze data for different channels like LinkedIn, email, phone, and others.
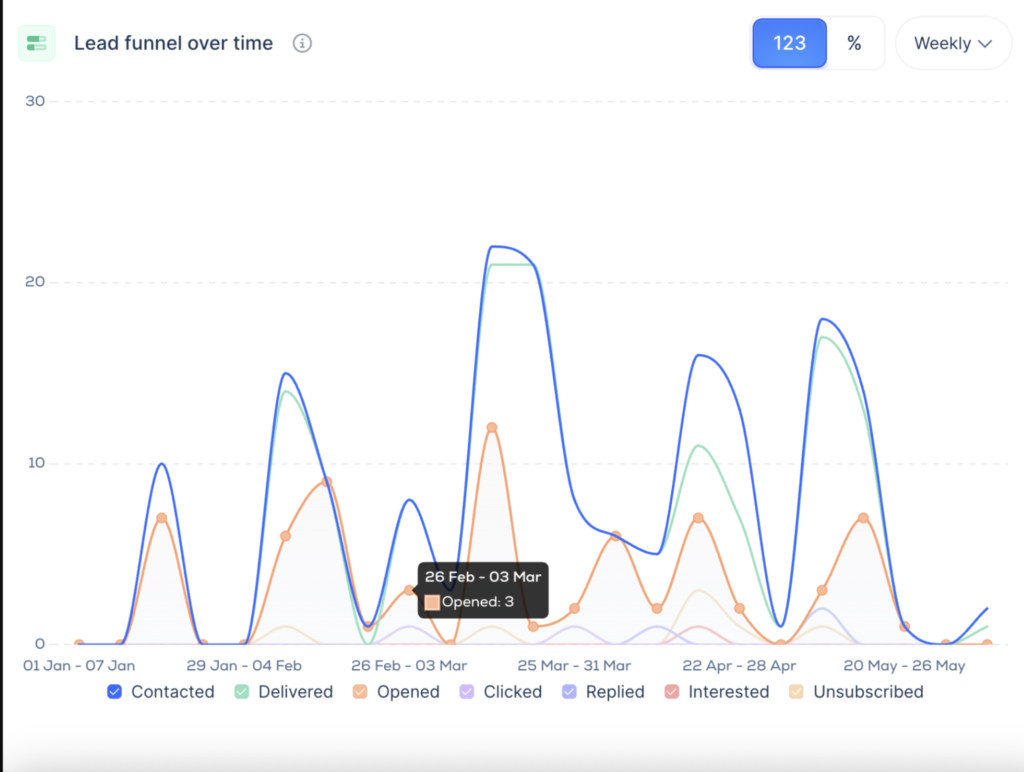
Widget #6: Lead funnel over time
Tracks the status changes of leads contacted during the selected period.
It shows how many leads were contacted, delivered, opened, clicked, replied, and marked as interested.
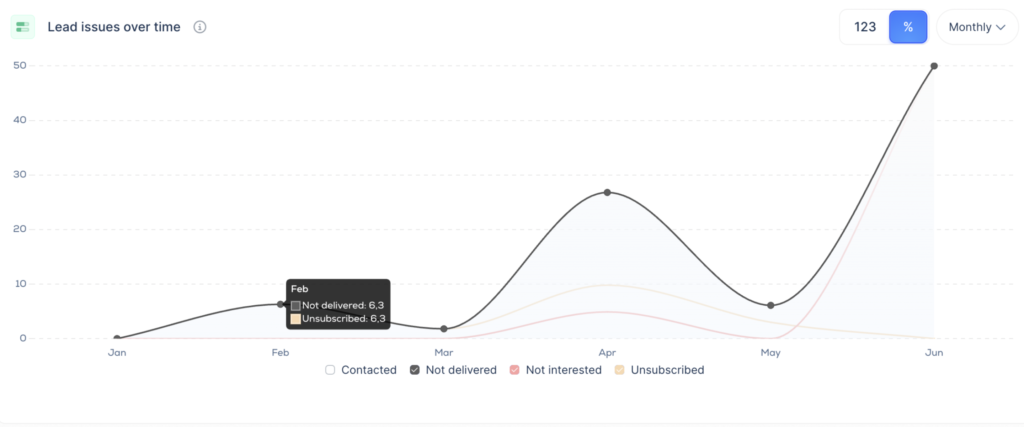
Widget #7: Lead issues over time
Tracks the number of leads who had issues during outreach.
Shows how many leads were contacted but had problems like emails not delivered or unsubscribed.
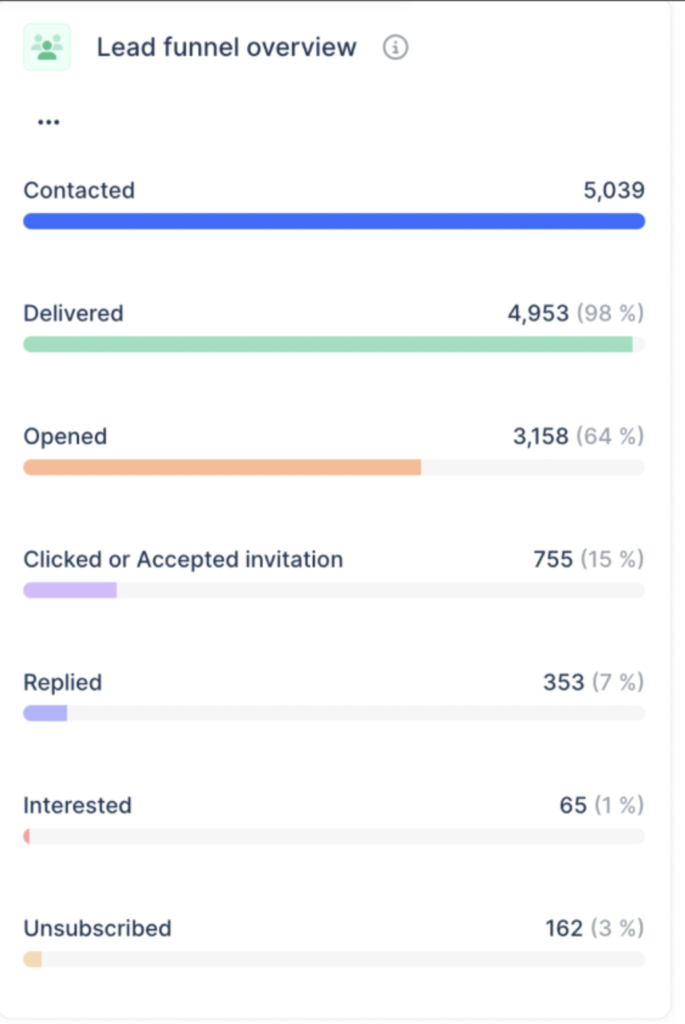
Widget #8: Lead funnel overview
This is another view of lead status changes, focusing on how many leads were contacted, delivered, opened, clicked, replied, and marked as interested.
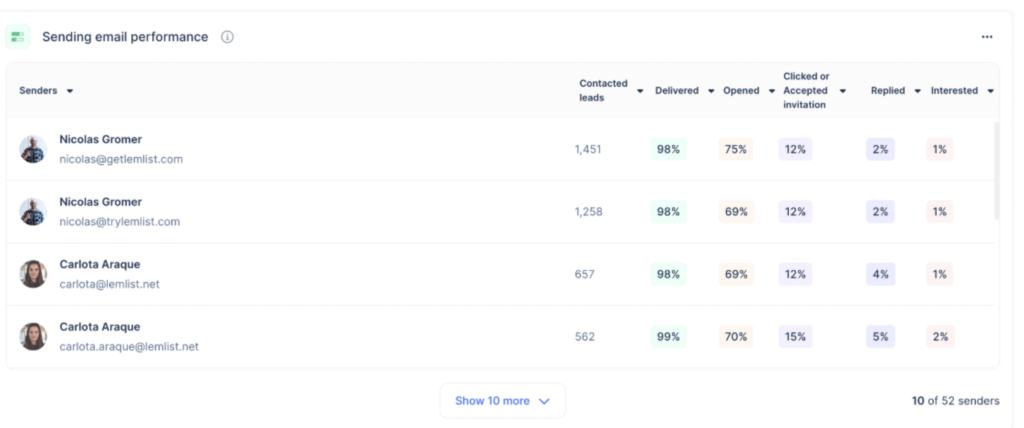
Widget #9: Sending performance
Shows the performance of your sending email addresses, tracking how many leads were contacted, delivered, opened, clicked, replied, and marked as interested.
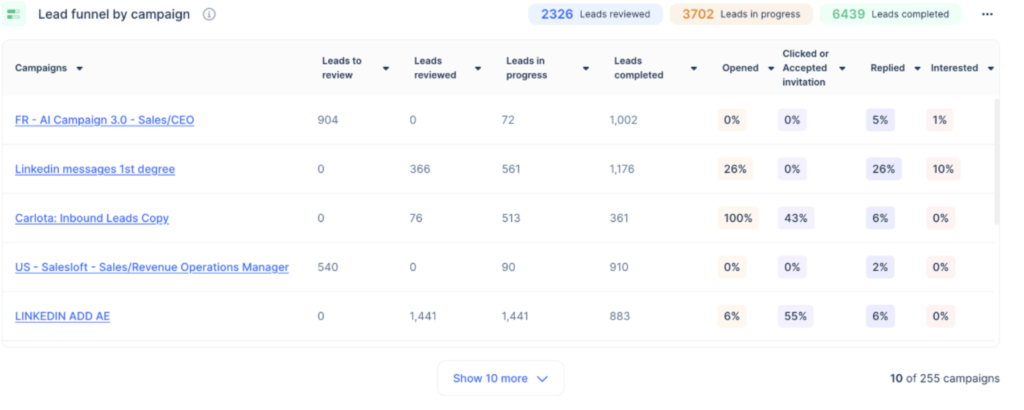
Widget #10: Lead funnel by campaign
Tracks lead status changes by campaign.
Shows how many leads are reviewed, in progress, completed, opened, clicked, replied, and marked as interested.
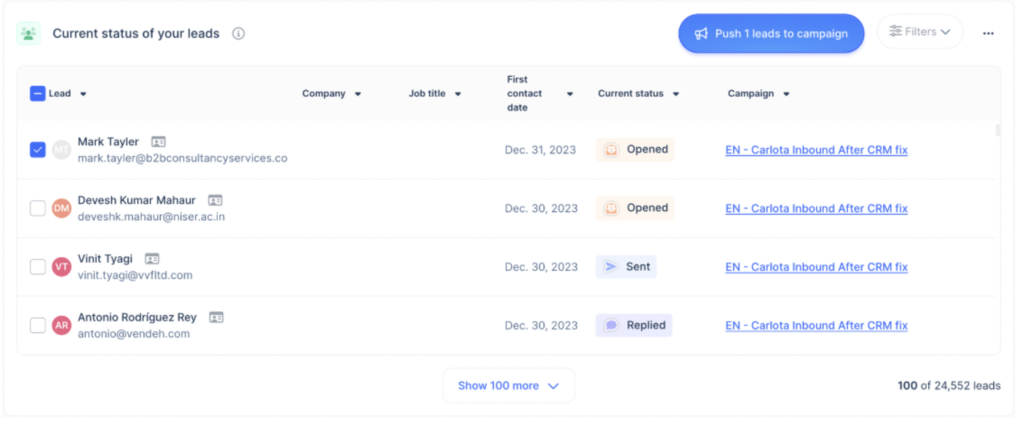
Widget #11: Leads in campaign
Shows leads based on their current status and allows you to push them to other campaigns.
You can filter leads by status, like opened or clicked, and move them to new campaigns.
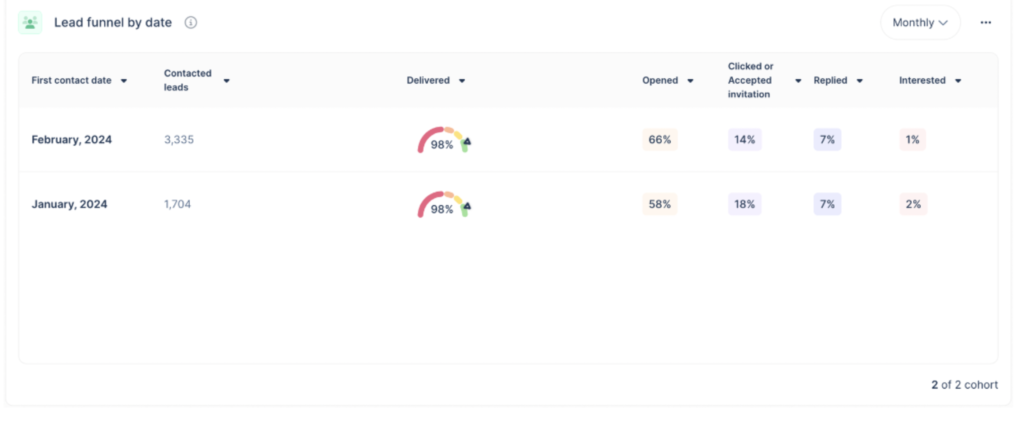
Widget #12: Lead funnel by date
Tracks lead status changes over time, like daily, weekly, or monthly views.
Shows how many leads were contacted, delivered, opened, clicked, replied, or marked as interested during each period.
Widget #13: Heading zone
Allows you to add headings between widgets to organize your reports better.

Widget #14: Text zone
Allows you to insert text blocks between widgets to improve the structure of your reports.

Best Practices
- Regularly check reports to spot trends.
- Use A/B testing to improve open rates and clicks.
- Keep your contact list clean to reduce bounce rates.
