
Tired of sifting through piles of sales data without a clear next step?
Without the right tools and methods, creating sales reports can feel like searching for a needle in a haystack.
And if you don’t have clarity over your sales performance by territory, you won’t know which actions to double down to improve efficiency and boost revenue.
In this article, get a step-by-step guide on creating a quarterly sales by territory report with a free Google Sheets template!
Why should you create quarterly sales by territory reports
Without proper sales insights, you won’t know which next step to take, and you will end up wasting time on activities that aren’t bringing cash.
On the contrary, quarterly sales by territory reports aren’t just sheets of data. They help you:
- Get in-depth insights: By breaking down sales data region-wise, you can pinpoint which territories are your gold mines and which need a strategy revamp.
- Create a winning strategy: Know exactly where to invest more time, training, or marketing efforts. Whether it’s a territory that’s underperforming or one that’s leading the charts, your strategies can be tailored to maximize results.
- Forecast precisely: By analyzing your sales data quarterly, you’re better equipped to predict the next quarter’s outcomes. This means you can set realistic targets, prepare for challenges, and capitalize on upcoming opportunities.
How to set up Google Sheets for sales reporting
Step 1: Set up Sheets, Tabs, and Formatting
[ ] Start by naming your Google Sheet something relevant, like “Q2 2023 Sales by Territory”
[ ] Create separate tabs for raw data, processed data, and visual reports.
This not only keeps your data organized but also ensures you have backups of your original data.
[ ] For formatting, use bold headers, gridlines, and alternating row colors to make your sheet visually appealing and easy to navigate.
Step 2: Import your data
You can import your data from another file, or from a CRM Report.
[ ] Go to File -> Import and choose the source of your data.
Remember to consistently format date columns and ensure currency symbols are uniform. This will save you a ton of time in the next steps.
Here is a quick video on how to import your CRM Report into Google Sheets
Step 3: Polish your data with Validation and Cleanup
Having clean and well-organized data makes inconsistencies stand out. Whether it’s a typo or a misplaced entry, a tidy spreadsheet makes these errors glaringly obvious, allowing for swift corrections.
Here’s an example of data you want to amplify in your sales reporting:
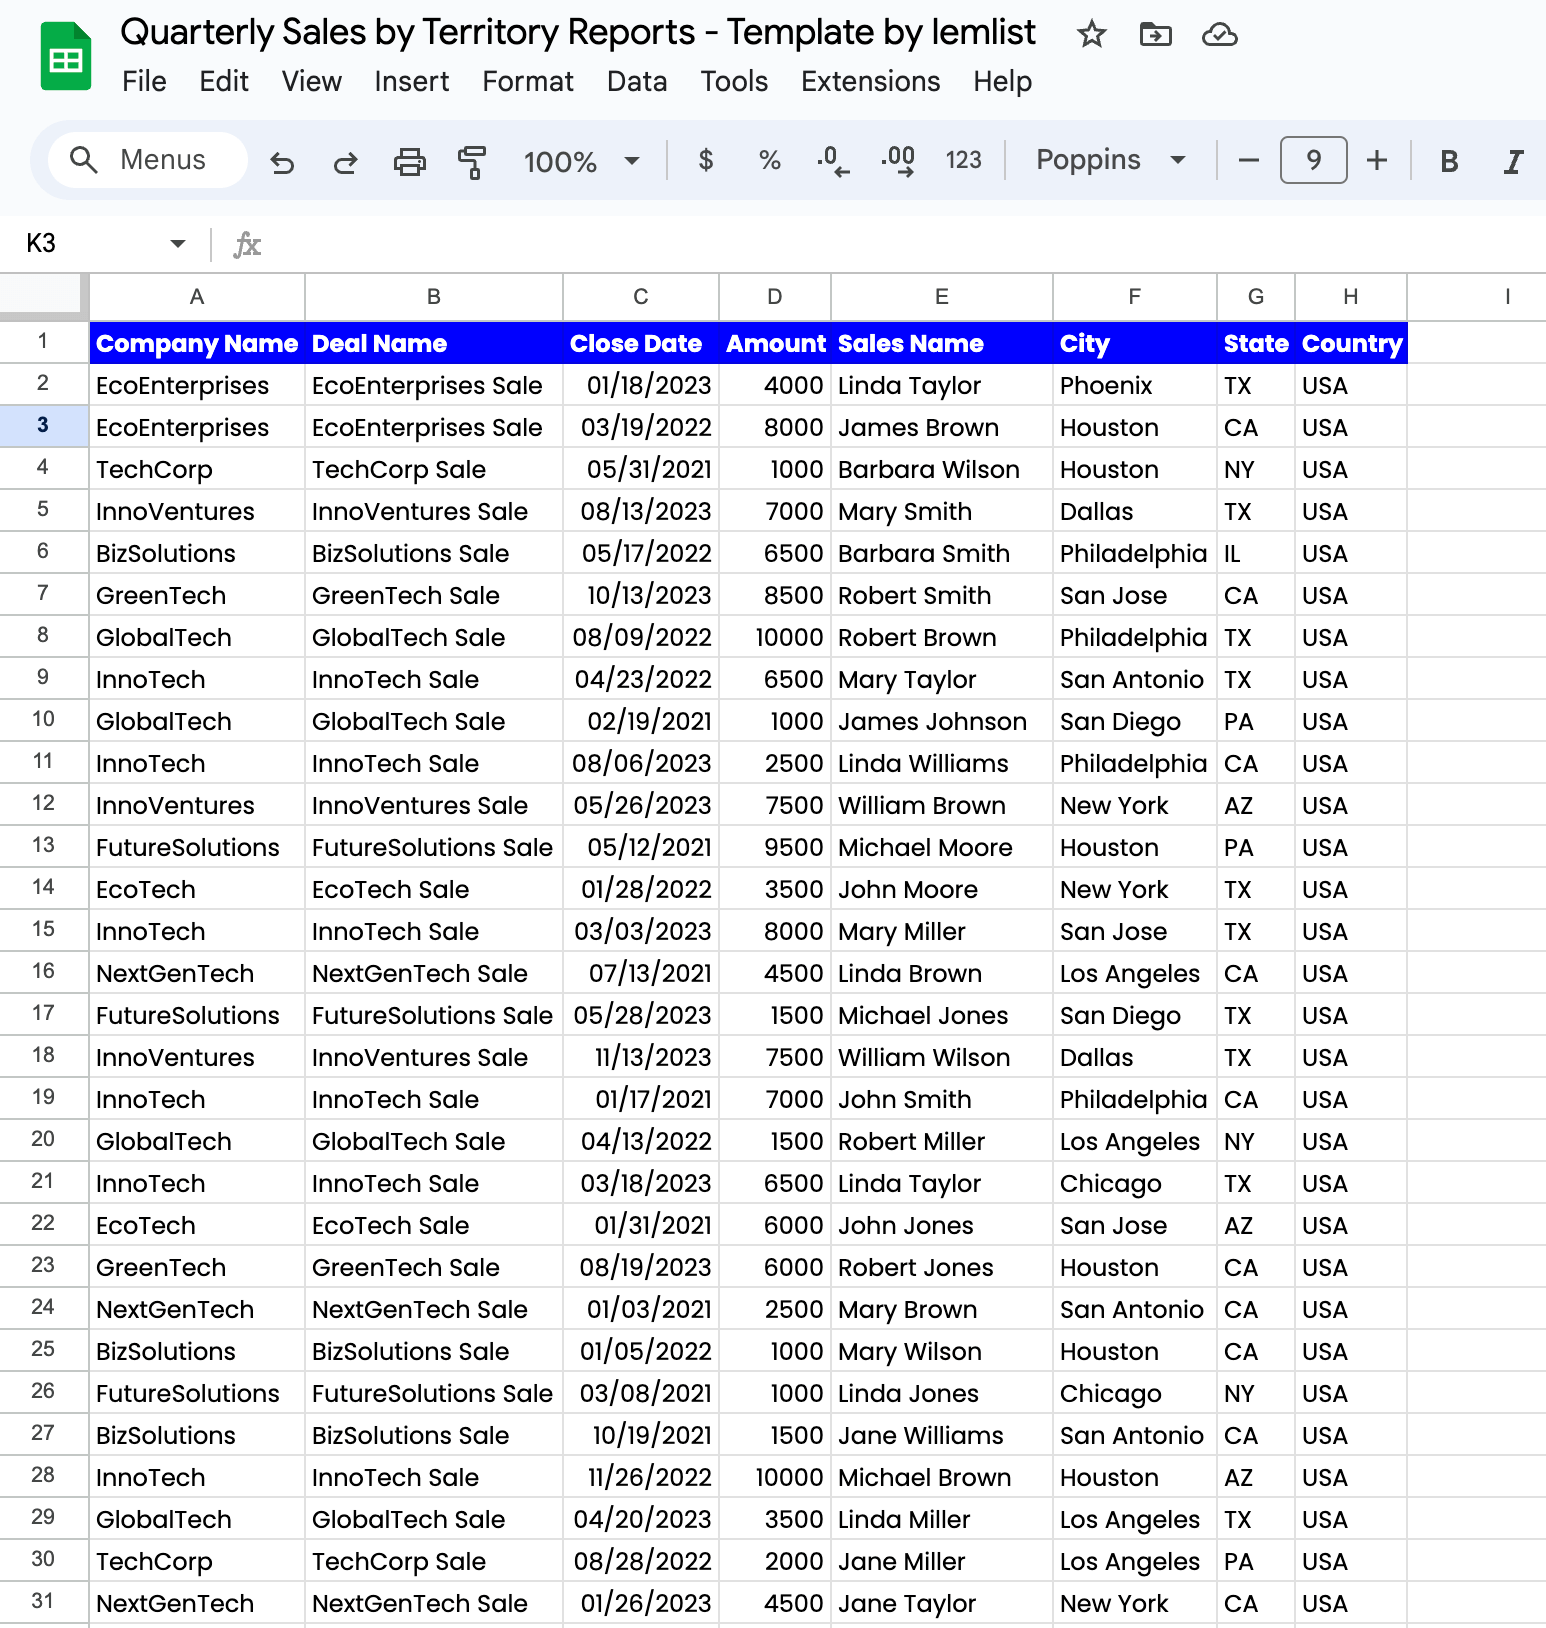
Here’s what data you need for a precise quarterly sales by territory report:
- Timing: This isn’t just about having dates. It’s about ensuring every date is in a consistent and recognizable format.
- Sales: It’s not just about numbers. It’s about ensuring every sale is recorded in a consistent currency format, without symbols or discrepancies.
- Territory: Think of this as your sales map. If some entries say “US”, others “USA”, and yet others “United States”, you’re looking at a map that’s leading you astray. Three different labels for the same territory? That’s a detour you don’t want.
But how do you ensure your data is 100% valid?
1. Leverage the power of data validation
By using Google Sheets’ Data Validation feature, you can:
- Confirm that a date isn’t just a random string but a valid entry. Use the “is valid date” criterion.
- Make sure each entry matches a predefined list, ensuring consistency. This is where the “dropdown” option comes in handy.
- Ensure every sales figure is a valid number, falling within a specific range. The “value” criterion is your go-to here.
- And if you’re feeling a bit more advanced, craft custom formulas to pinpoint and weed out those pesky inconsistencies.
Need more details? Check out this video tutorial that walks you through spotting and rectifying incorrect dates. Remember, a date that’s off will throw your entire quarterly sales by territory report off track.
2. Use the “Unique” Formula
Enter the “Unique” formula in Google Sheets. Think of it as your data’s magnifying glass. With just a simple formula, it points out all the distinct values in a column, making discrepancies stand out.
For instance, let’s tackle the pesky “US” vs. “USA” vs. “United States” dilemma. By applying the “Unique” formula, you’ll instantly see all three variations, allowing you to spot and rectify inconsistencies in a snap.
Step 4: Transforming dates into quarters
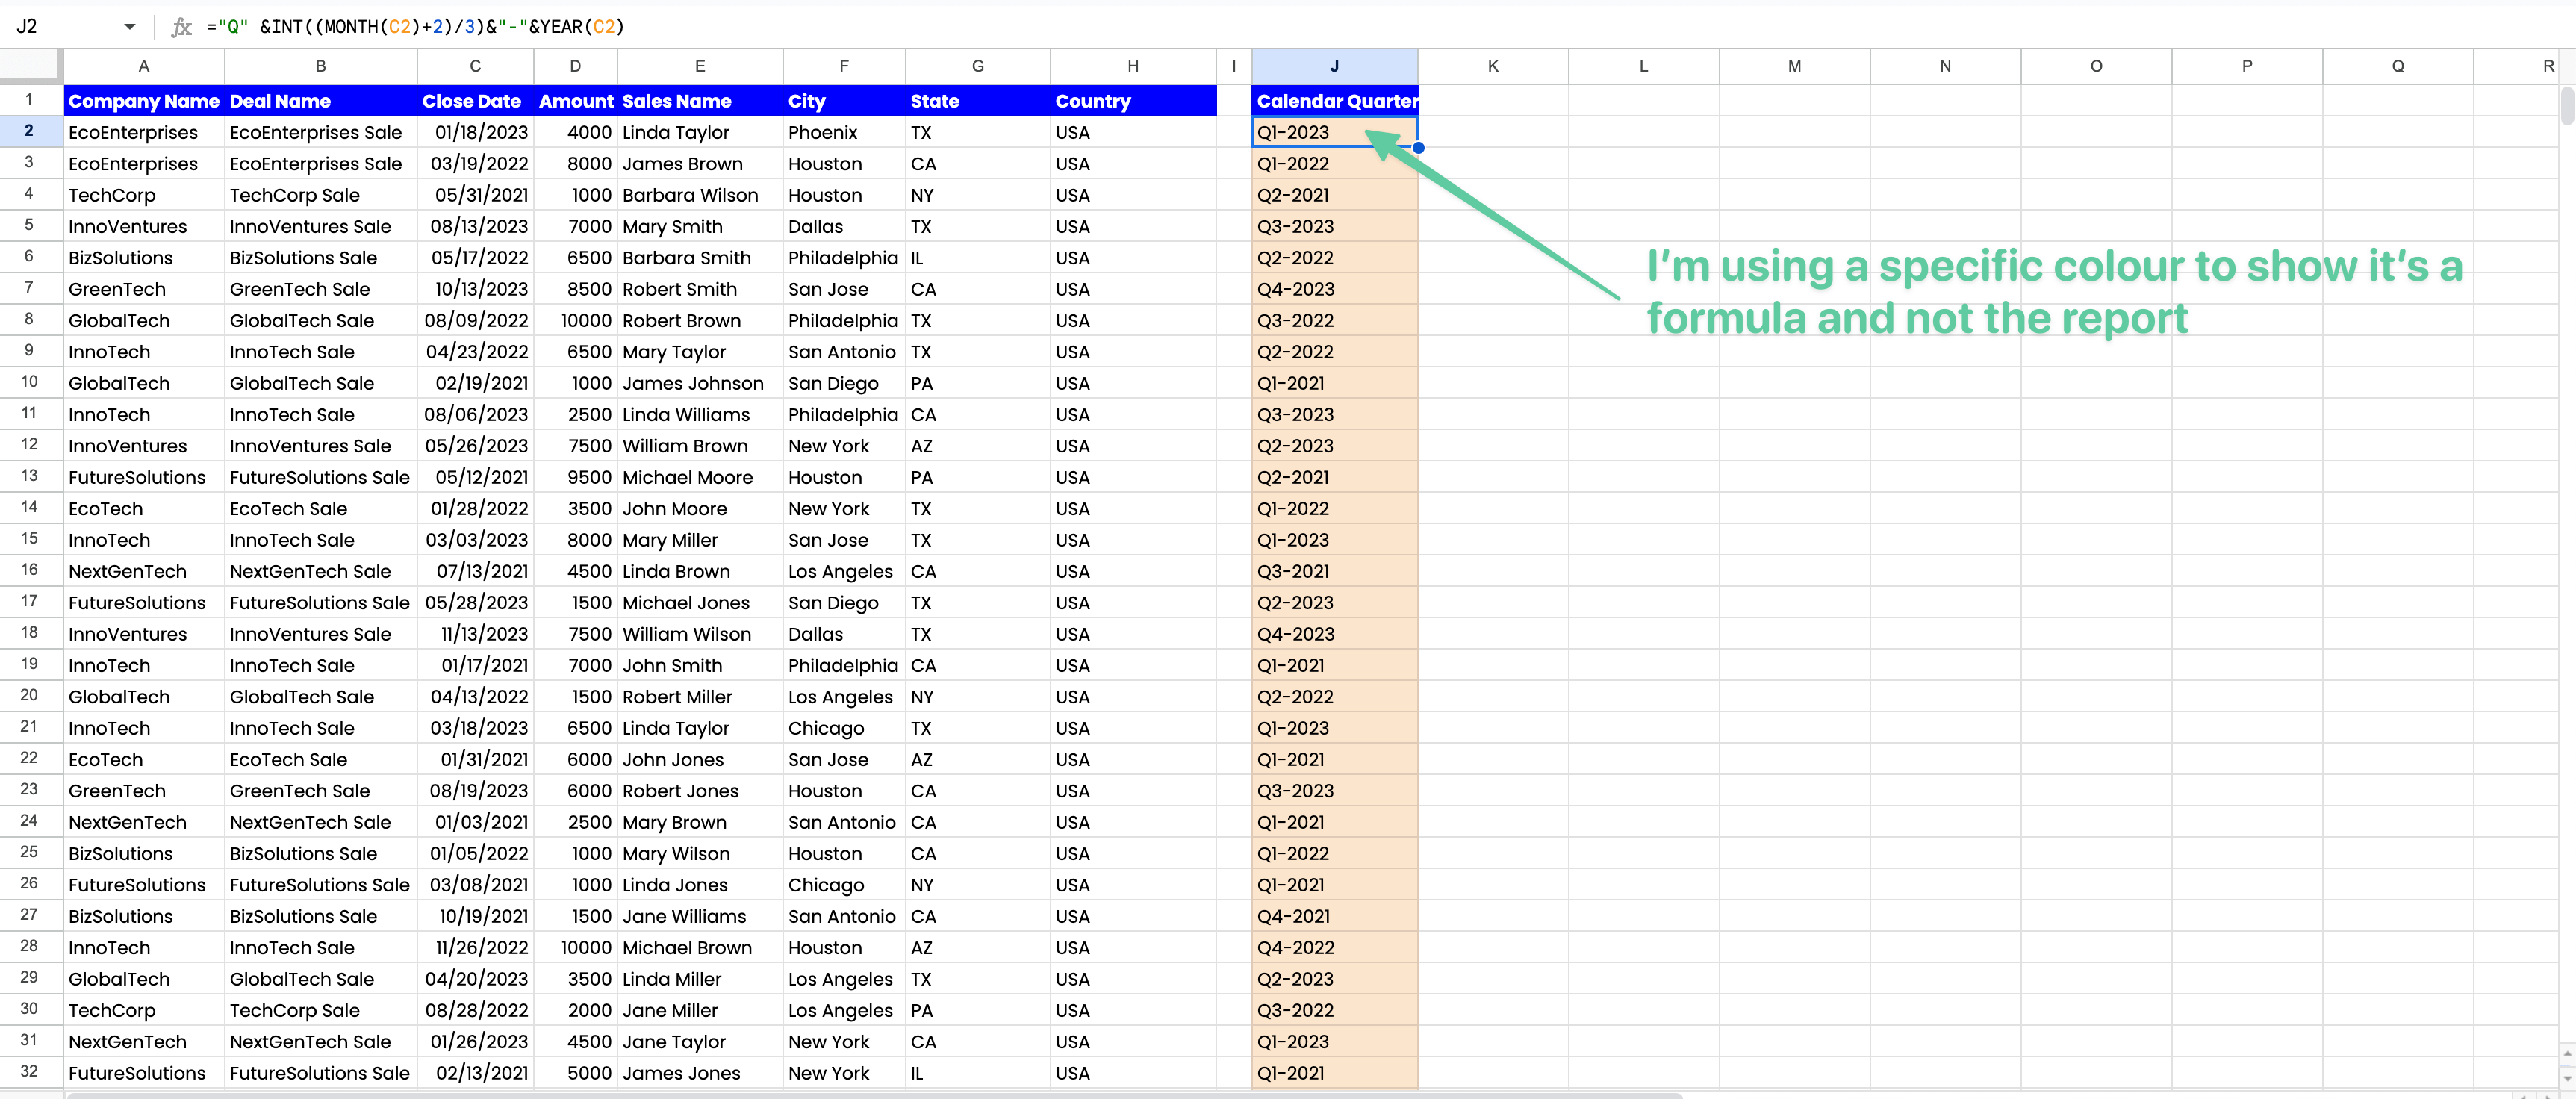
If your initial data doesn’t already categorize sales by calendar quarters, you can use Google Sheets’ formula:
For a date nestled in C2, enter “Q” &INT((MONTH(C2)+2)/3)&”-“&YEAR(C2)
You’ll see something sleek like “Q2-2023”.
Let’s break it down:
- “Q” ensures every quarter kicks off with a ‘Q’.
- The ‘&’ symbol tells Google Sheets you’re blending text with a formula.
- “INT((MONTH(C2)+2)/3)” computes an integer based on the date’s month. For January, the math goes: (1+2)/3, landing you with Q1.
- &”-”& crafts a neat separator between the quarter and the year.
- YEAR(C2) fetches the year in a four-digit format.
With this formula, any date transforms into its calendar quarter.
Pro tip: Color-code calculated fields. It’s a visual cue, reminding you these aren’t raw data but crafted insights!
Step 5 (option 1): Create your quarterly sales by territory with pivot tables
Pivot tables will help you turn your raw numbers into a sleek, insightful report.
Here’s how
1. Select Your Data by clicking anywhere within your table
2. Hit CMD + A (for Mac) or CTRL + A (for Windows) to grab every piece of data.
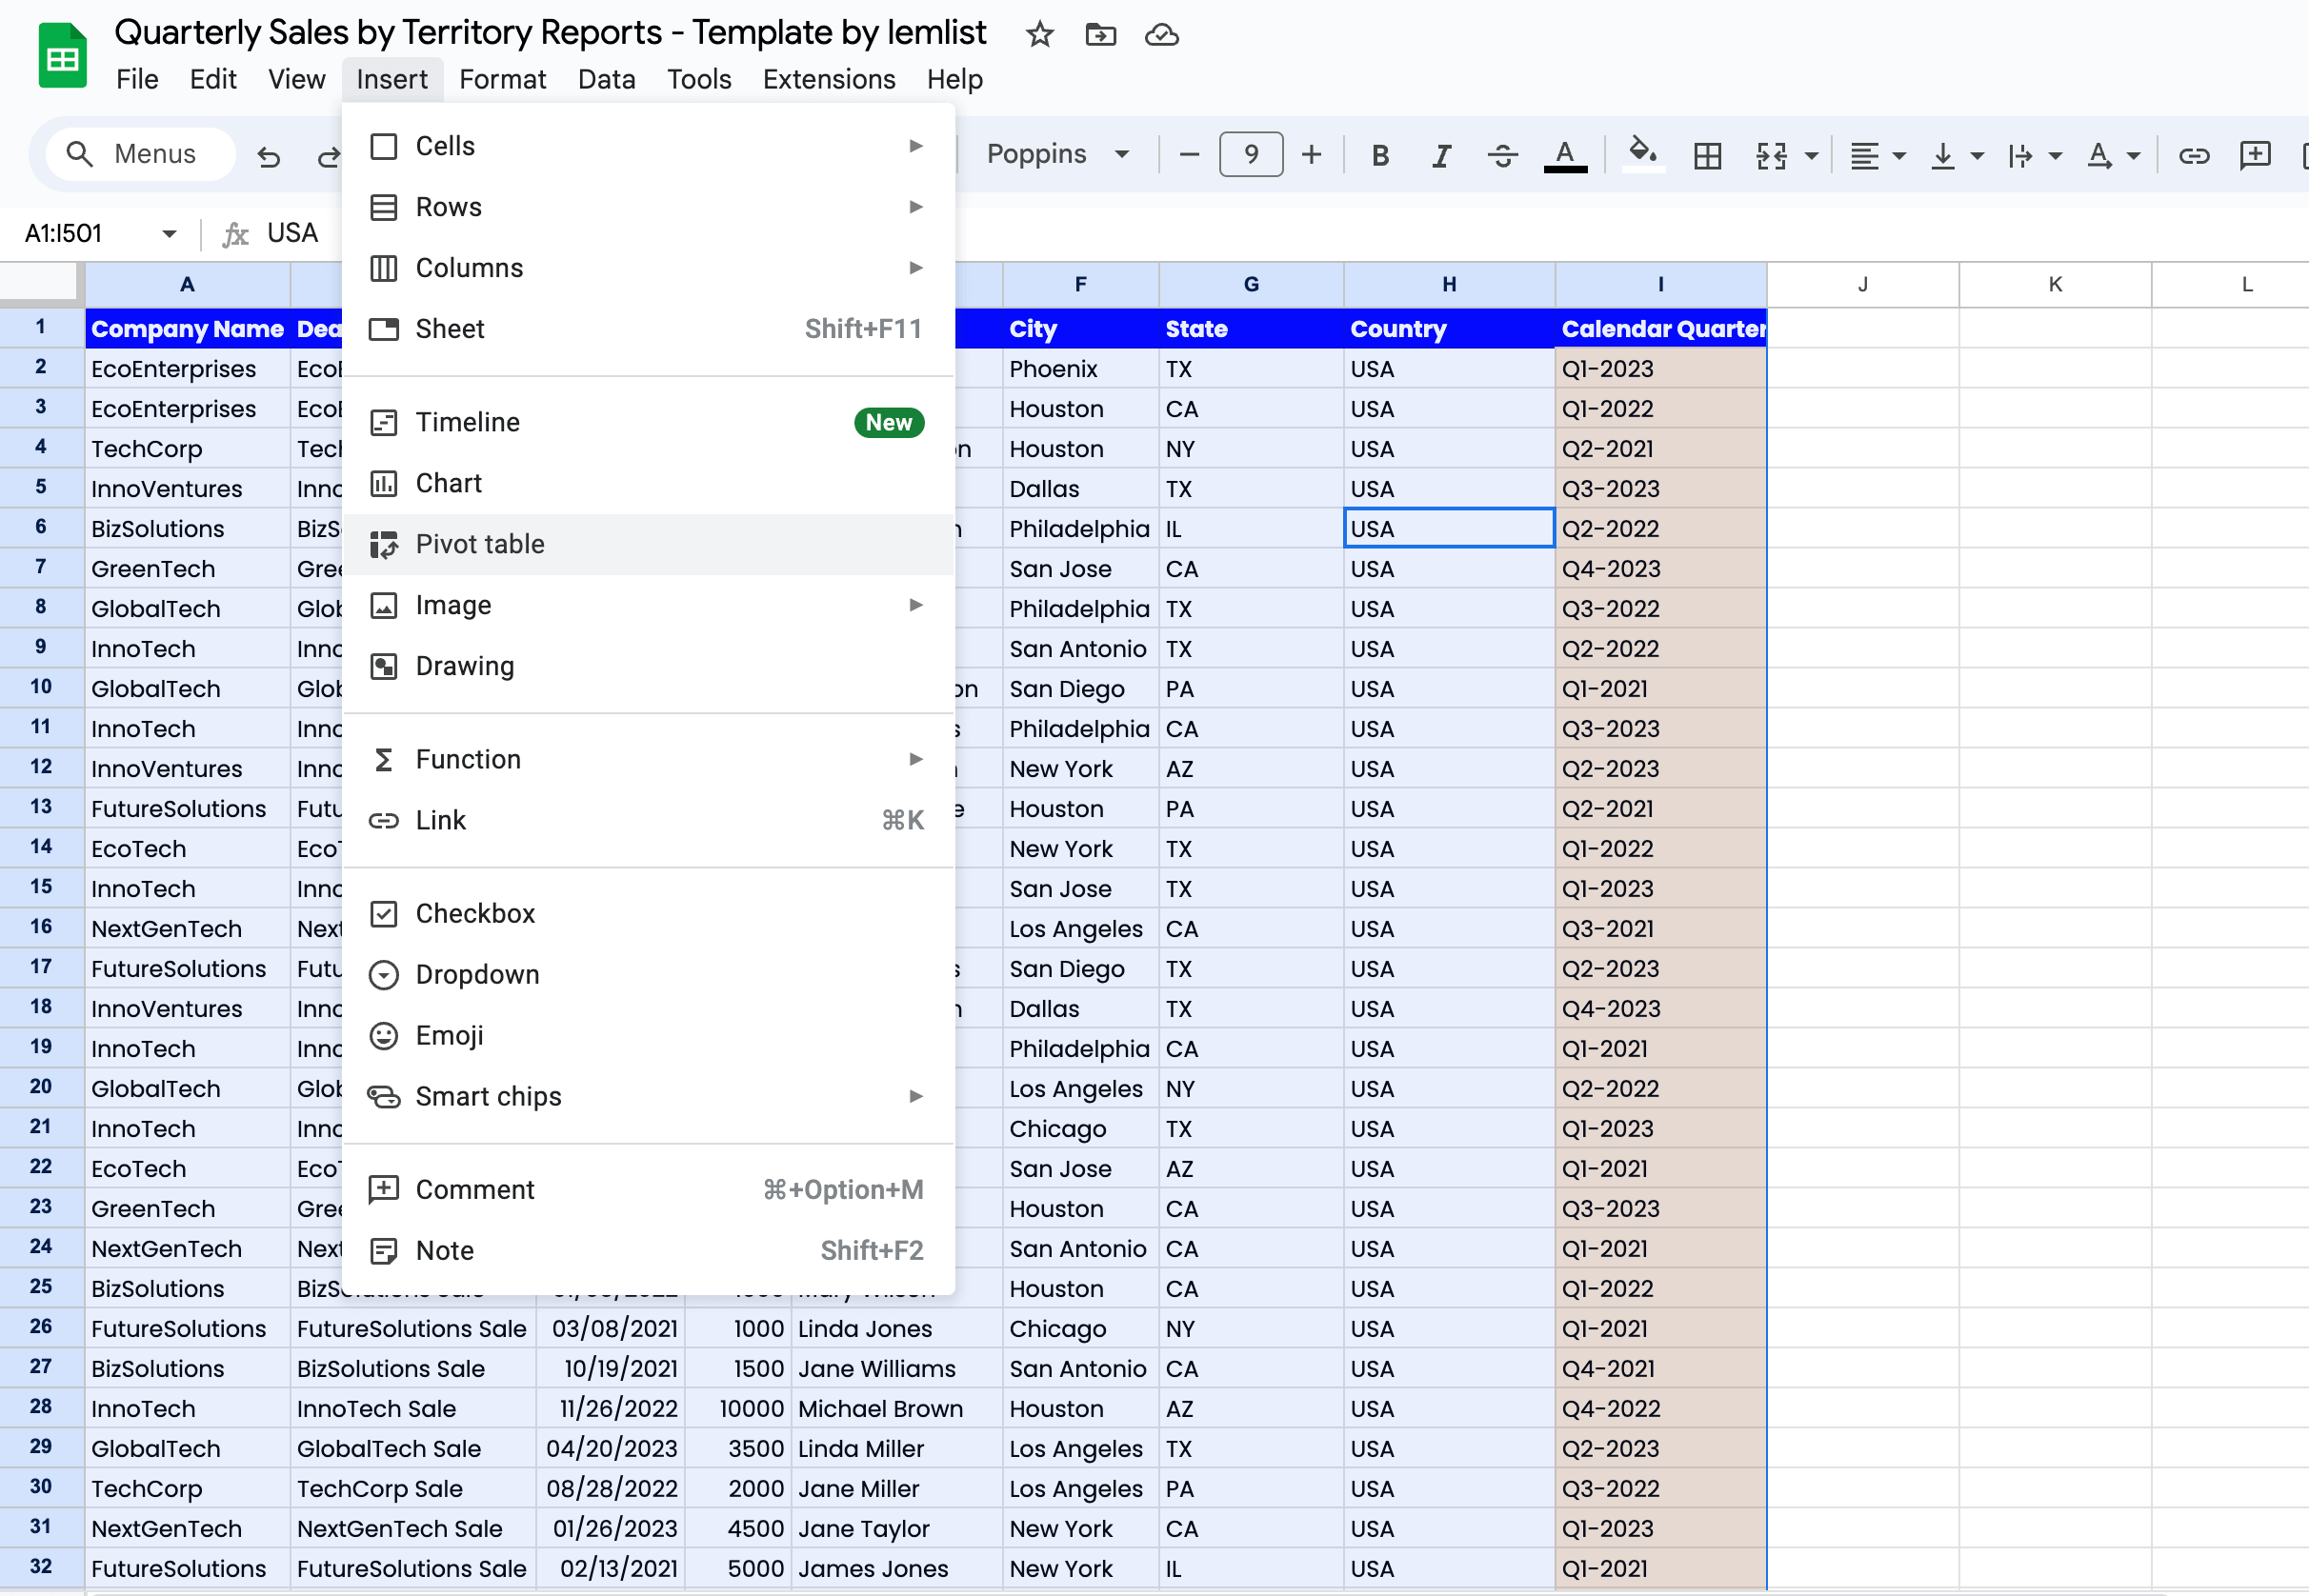
3. Navigate to the ‘Insert’ option in the menu bar and choose “Pivot Table”.
4. Verify your data range to ensure you’ve captured the entire table
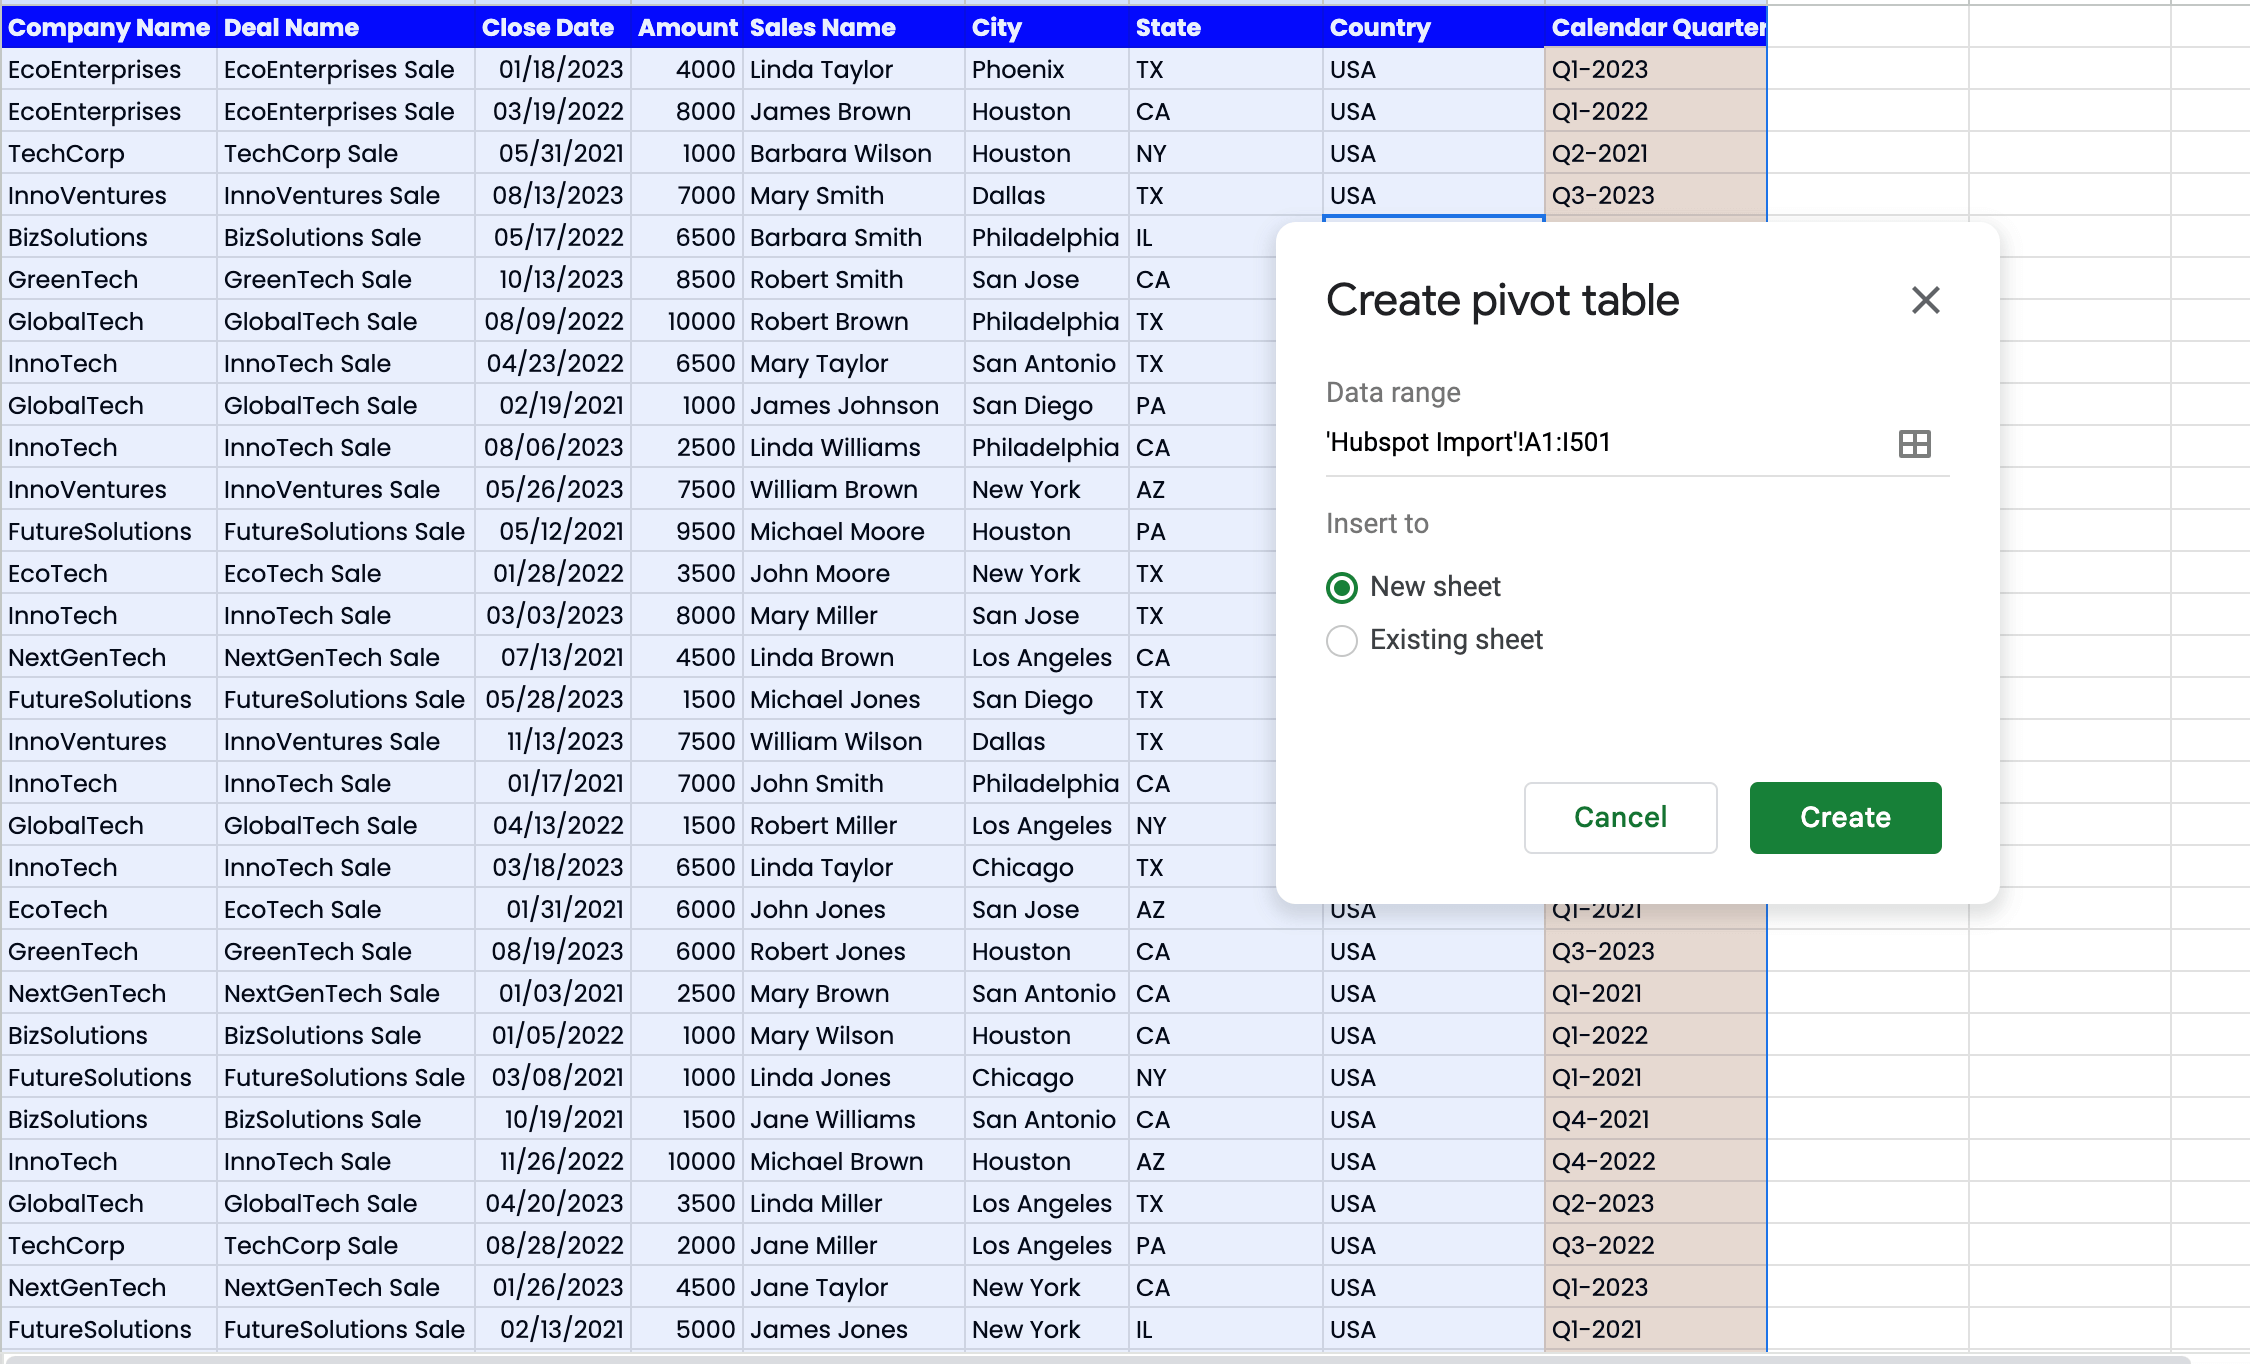
5. Opt to create the Pivot Table in a fresh, new sheet
6. Polish your pivot table:
- For “columns”, flaunt the Calendar Quarter column
- In the “rows” section, showcase the Territory. For this example, we’re using ‘States’.
- And for “values”, spotlight the sales amount. It should default to a SUM but double-check it just to be sure.
Feeling like a pro? Flip the script by swapping columns and rows. It’s all about what layout suits your style!
Step 5 (option 2): Create your quarterly sales by territory with manual tables
Pivot tables are swift and efficient, but might not always fit the unique design vision you have in mind.
In that case, you can enter manual tables to get precision and customization down to the last stitch.
It’s all about hand-picking your columns and rows and then wielding the power of the SUMIFS function. This formula will seamlessly put together criteria from each column and row to present a cohesive picture.
Watch the video linked below and see how to craft a manual report in just 60 seconds!
One of the perks of crafting a manual table?
The freedom to design.
Unlike the preset confines of a Pivot Table, manual tables give you more space for creativity.
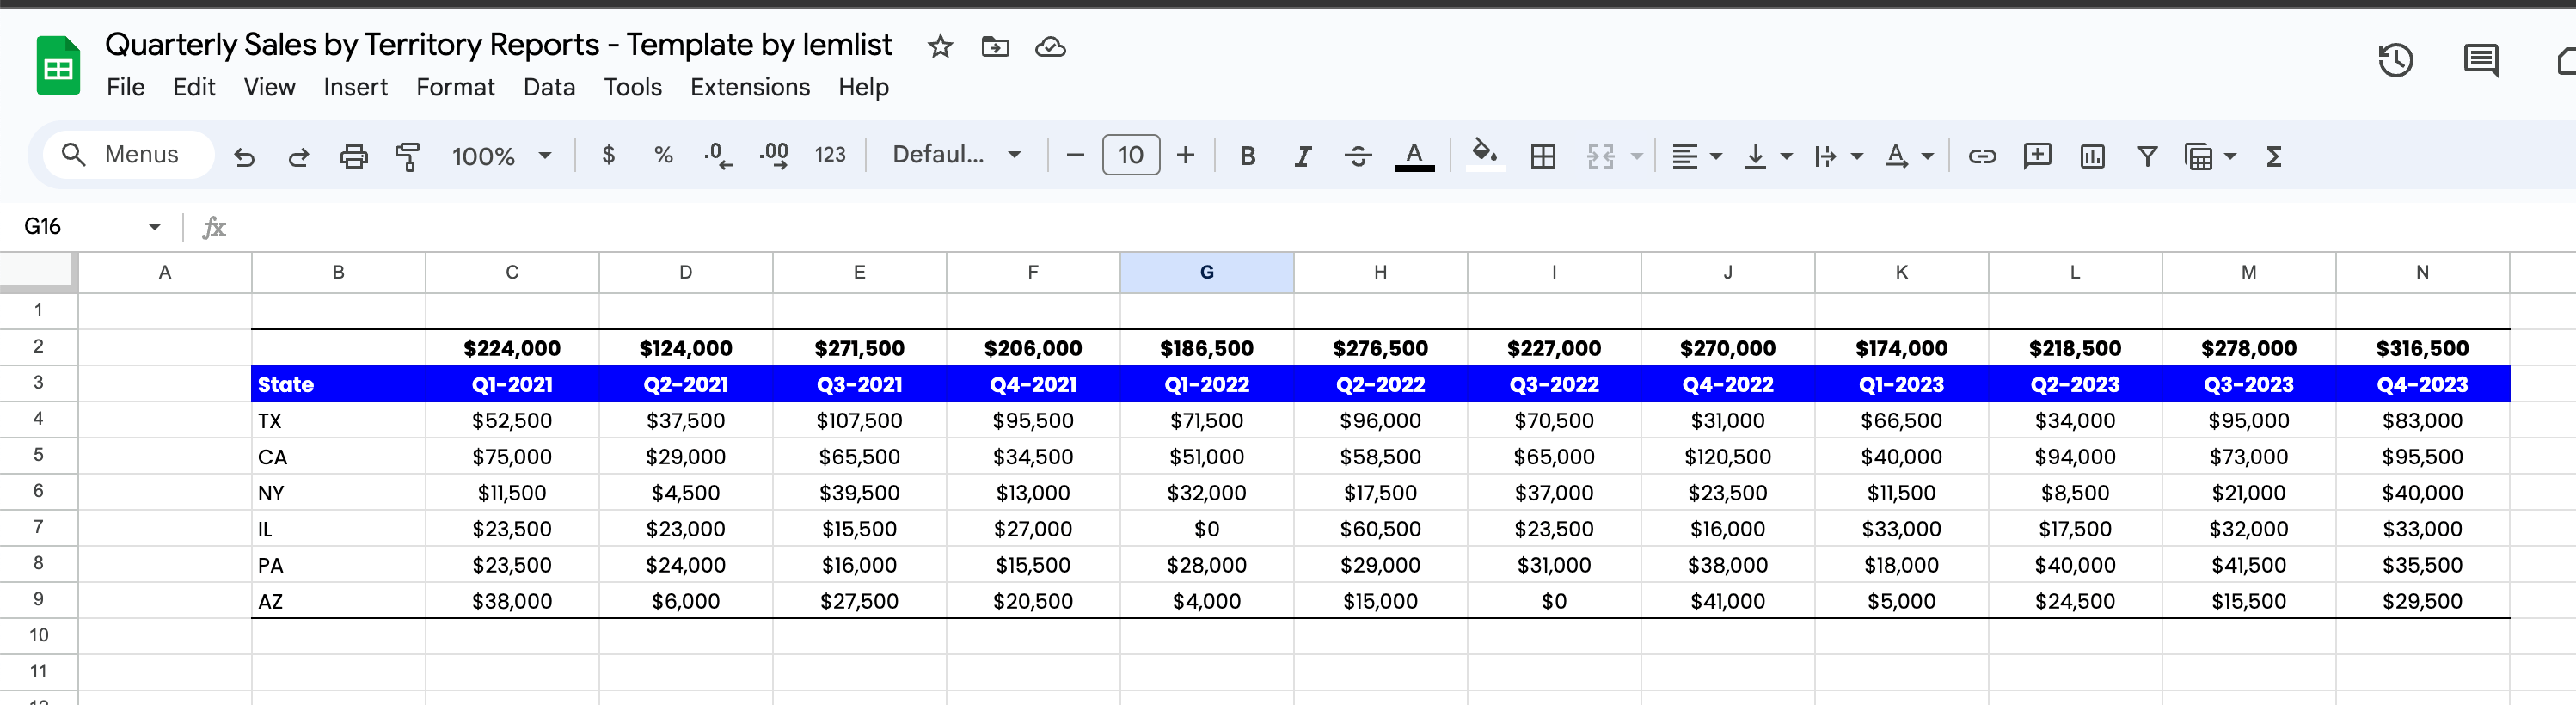
Here’s an example of a quarterly sales by territory report made with this manual method:
Step 6: Enhance your Quarterly sales by territory report with a chart
If you want to make your Quarterly sales by territory report even more impactful, add a chart and provide a visual representation that’s both clear and compelling.
Here’s how to integrate a chart into your Quarterly sales by territory report:
1. Select your data by highlighting the entire table containing your Quarterly sales by territory data.
2. Go to ‘Insert’ and select ‘Chart’.
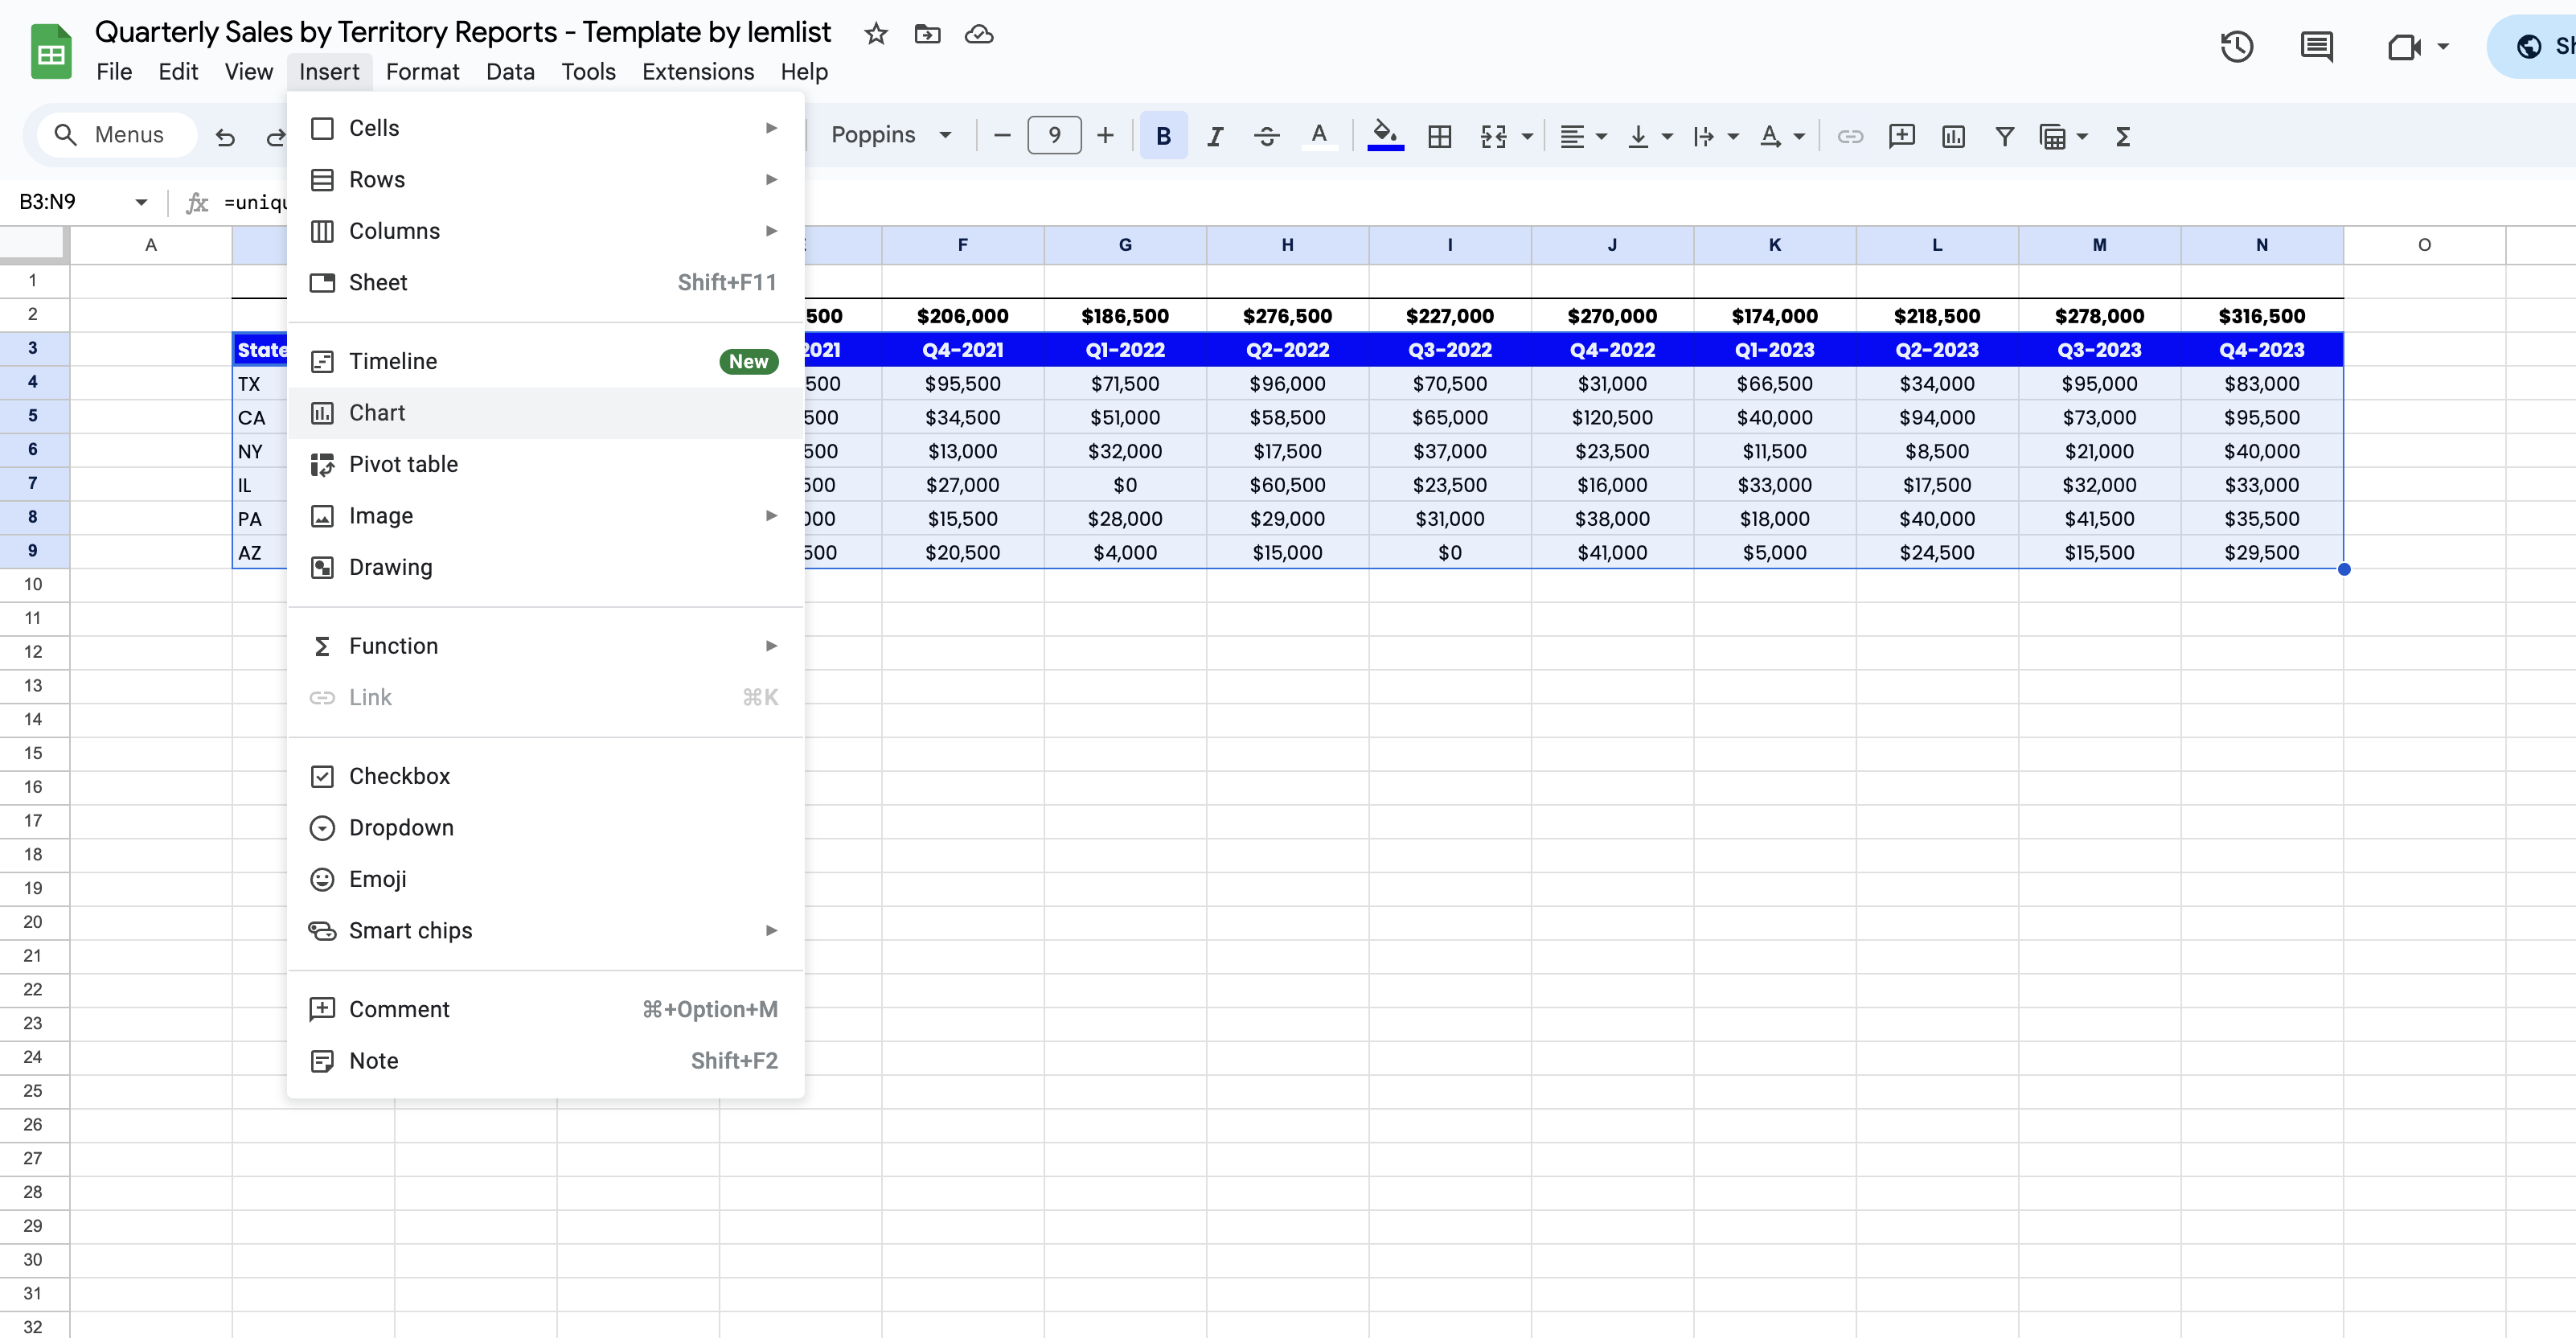
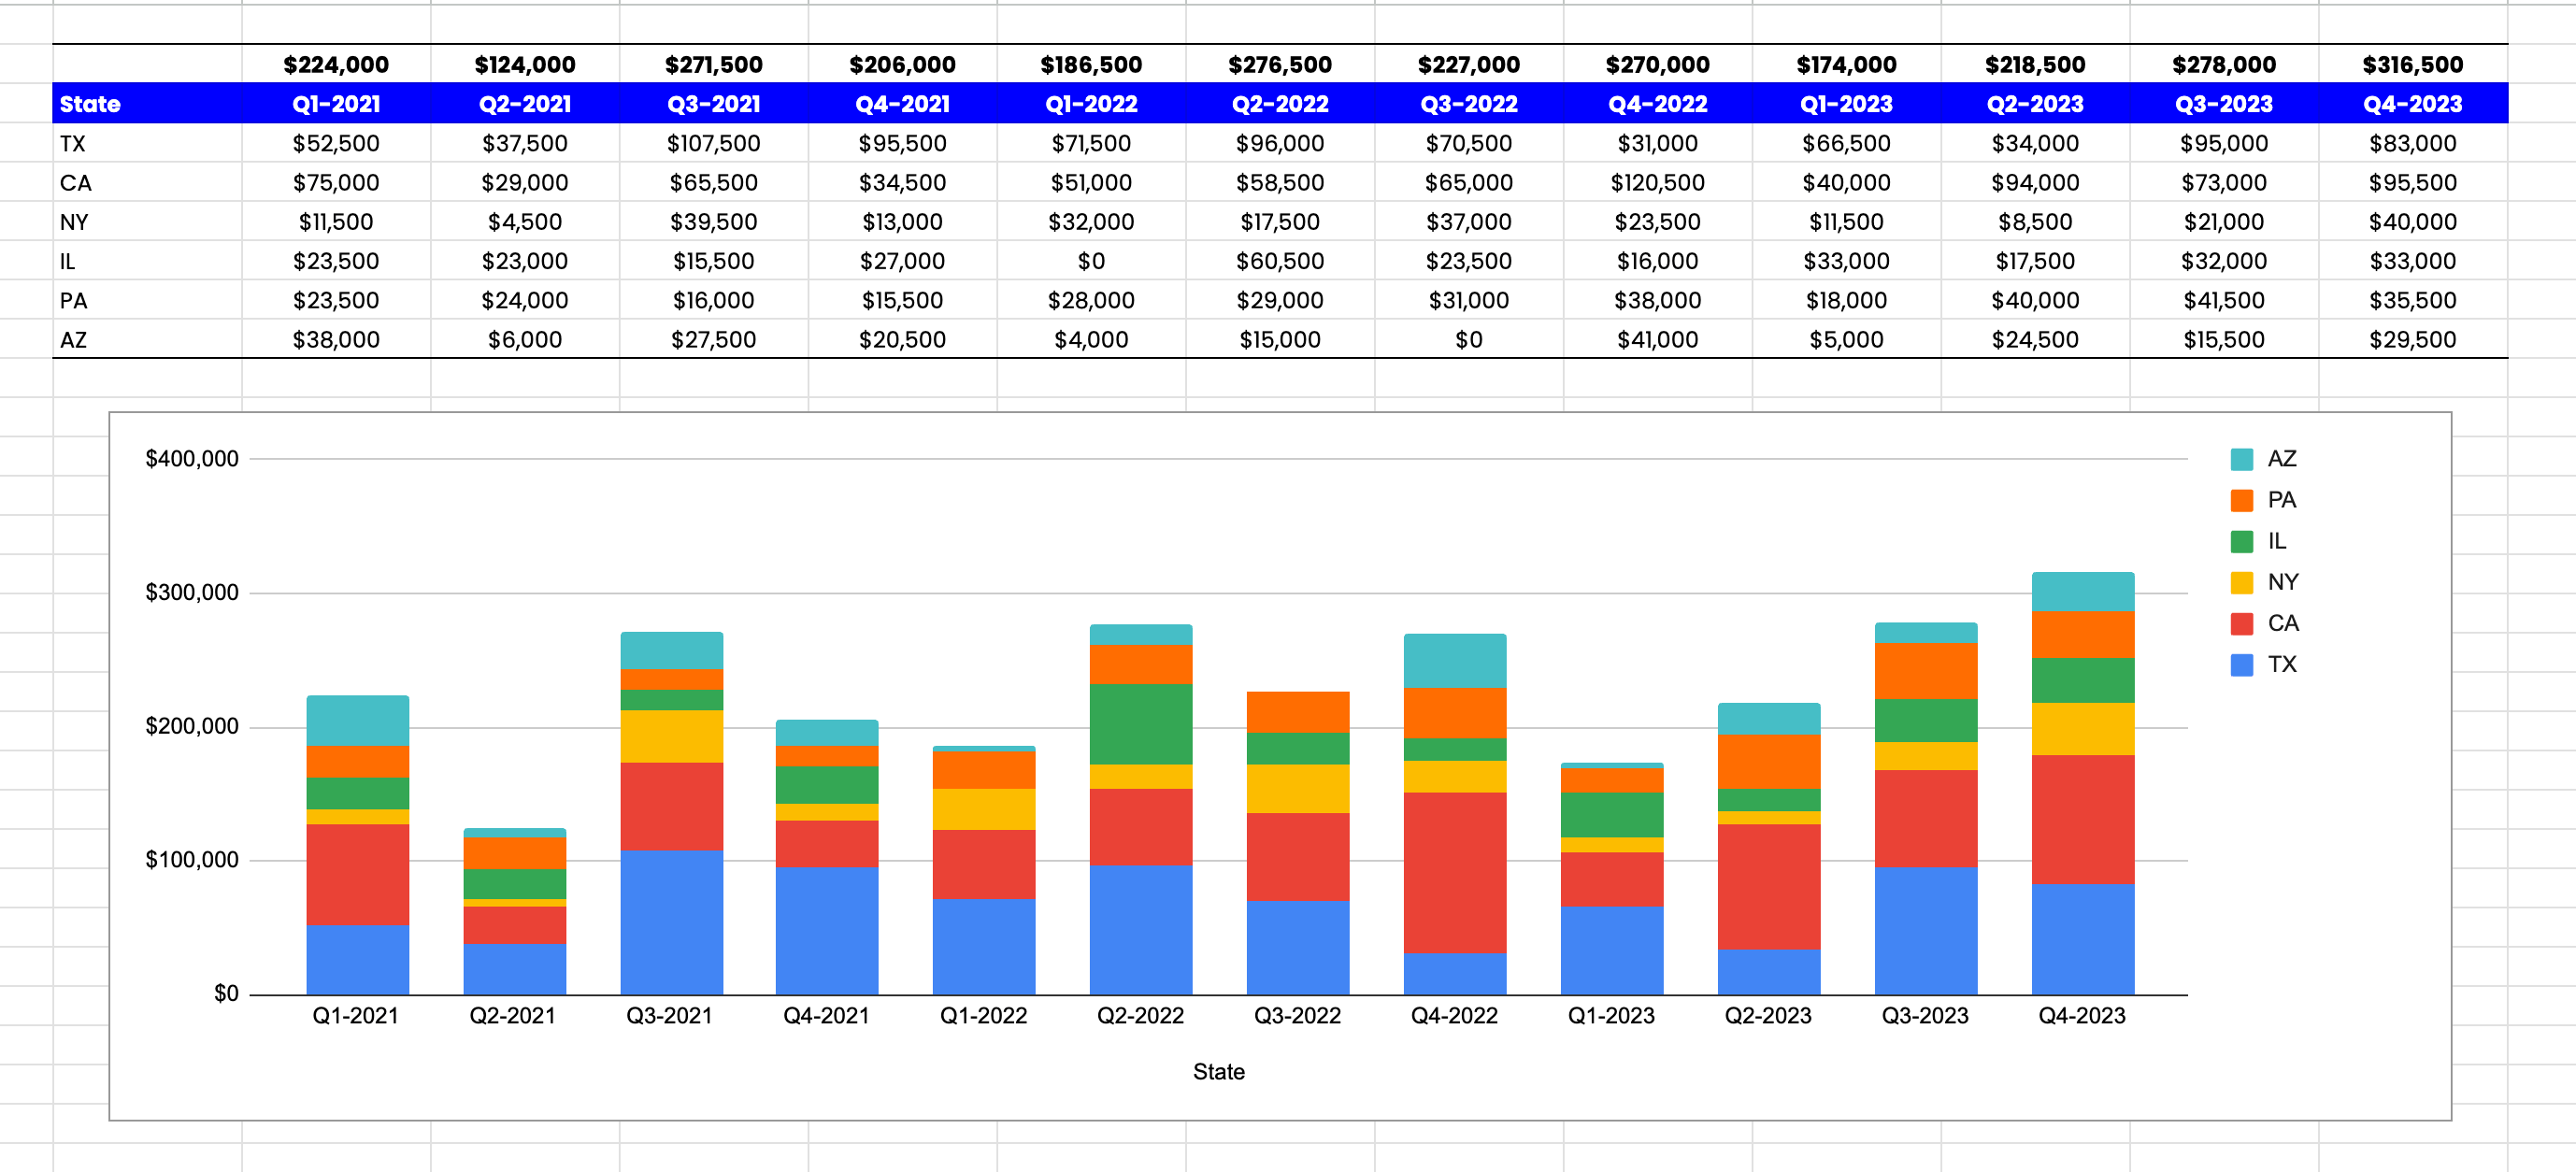
3. Depending on your preference and the nature of your data, choose the chart type that best represents your Quarterly sales by territory. Options range from line graphs to bar charts, and you can decide on stacked versions if needed.
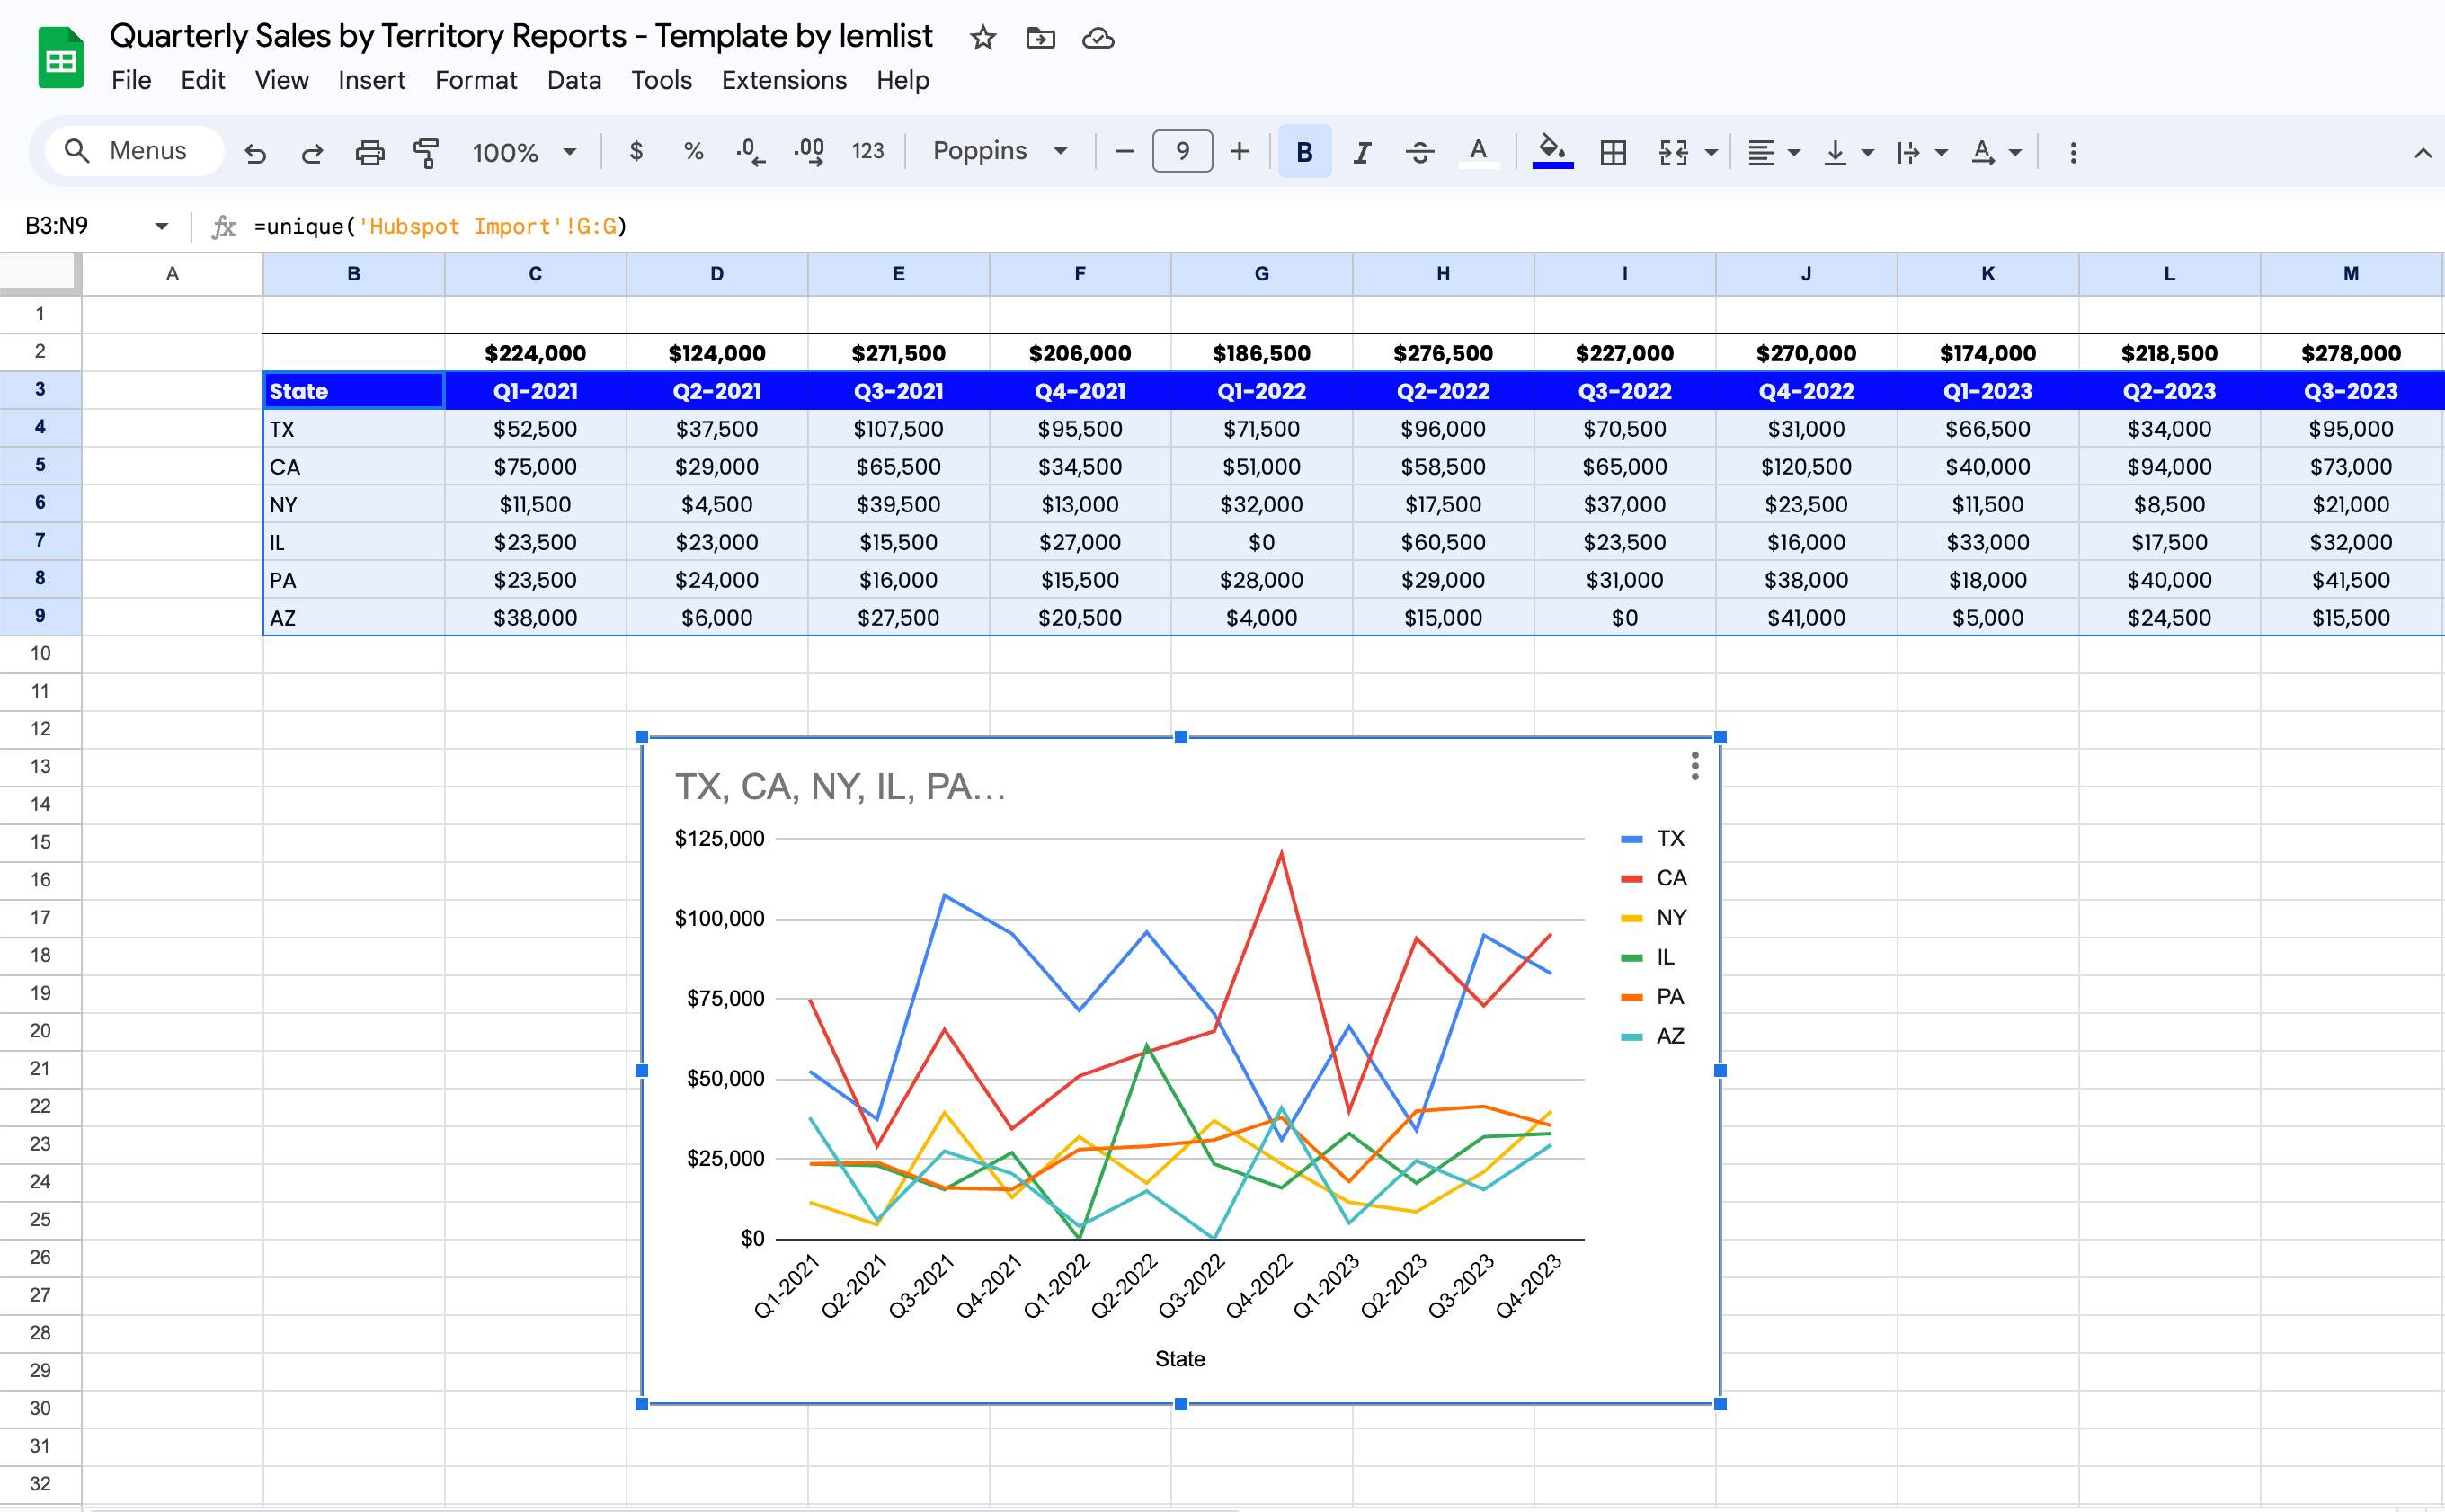
4. Make necessary style adjustments to ensure clarity and readability. Remember, the goal is to make your Quarterly sales by territory data easily scannable at a glance.
With these steps, your Quarterly Sales by Territory report will be not only informative but also visually appealing, making it easier for stakeholders to understand and act upon!
The key takeaways + Free Google Sheets template
In today’s data-driven landscape, having a precise and well-organized Quarterly sales by territory report is a must. Not only does it provide invaluable insights into sales performance across different regions, but it also helps you make informed business decisions.
From importing and validating data to crafting detailed charts, each step plays a crucial role in ensuring the report’s accuracy and usability. By following the outlined steps and best practices, you can ensure that your report is both reliable and impactful!
As you move forward, remember the importance of regular data validation and the potential of tools like Pivot Tables and manual tables. With a well-structured Quarterly sales by territory report in hand, you’re equipped to drive strategic sales initiatives and achieve business growth!
P.S. To help you create a precise and compelling report, you can use this free template and start boosting your sales efficiency!


